Python and the STFT
I’ve been going through biosonar data and while the SciPy specgram method is serviceable, I was interested in a short-time Fourier transform (STFT) implementation. There are a couple of ad hoc routines on Stack Overflow and the like, but I’ve started off with the Google Code PyTFD module. There are others out there as well, at least two projects including an STFT implementation are aimed at extracting time and frequency data from musical recordings. I may have a look at one or both of those at some point.
In any case, installing PyTFD involves downloading the code via Subversion and then running the setup.py script.
Since I spent more time than I think was absolutely necessary getting a couple of examples done with the STFT, let me run through an example in the hopes that helps somebody.
<br />
# Imports<br />
from __future__ import division<br />
from pytfd.stft import *<br />
from pytfd import windows</p>
<p>import numpy as np<br />
import numpy.fft as nf<br />
import matplotlib<br />
matplotlib.use(‘Agg’)<br />
import scipy<br />
import scipy.signal as spsig<br />
import pylab<br />
from pylab import *</p>
<p># […]</p>
<p> w = windows.rectangular(8)<br />
Y_stft = stft(clkdata,w)<br />
extt = [0,Y_stft.shape[0]*1e-6,0,5e5]<br />
pylab.imshow(abs(Y_stft)[Y_stft.__len__()//2:],<br />
extent=extt,<br />
aspect=”auto”,<br />
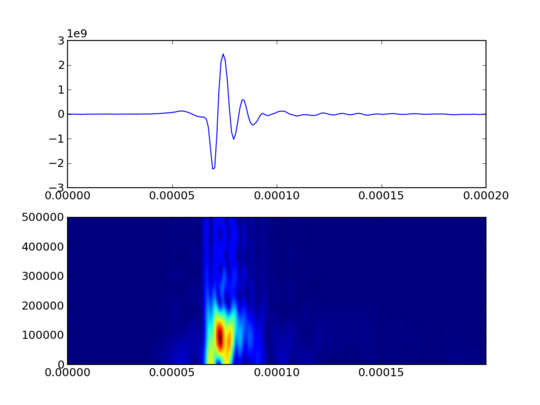
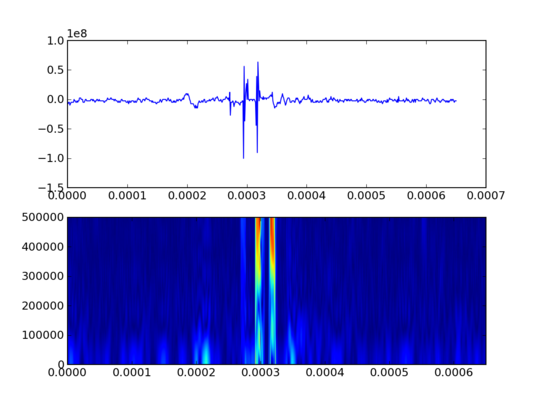
origin=”upper”)<br />OK, so there’s a fair amount of things to be imported along the way. The first three items (lines 2 to 4) are specifically for setting up access to PyTFD’s STFT method. Line 18 sets up the window function to use in the STFT. Line 19 actually does the work, getting the resulting multidimensional Numpy array with the STFT result given a Numpy array input and the window.
Line 20 sets up the extent array to express the size of the X range and the Y range covered by the STFT. Lines 20 to 24 puts the result in a subplot. There are some issues there. The STFT results are essentially a whole series of Fourier transforms, and those have both negative and positive frequencies, and are complex values to boot. So the “abs” function provides a magnitude for each point. The slice yields just the positive frequency range. Then the extent gets set to the range represented by the STFT. The “aspect” parameter is set to “auto” so that the X and Y ranges can be calculated separately by Matplotlib. The “origin” is set to “upper” to put the frequencies in the expected orientation.
Here’s a couple of the outputs:
The other packages with STFT implementations that I’ve found so far:
TPTSIG, a package implemented for a Ph.D. dissertation looking at decomposition and analysis of musical recordings.
PyMIR, Python Music Information Retrieval, another academic effort. PyMIR does not have a package setup script and looks to be commented in Portugese.
If anyone knows of other Python STFT implementations, please leave a comment with that information.